Data says where people drop off. It never says why.
How we read a year of funding news and 100 Arabic websites, what the numbers proved, what they could not, and how to run data analysis as a design method, with or without AI.
On this page
- Key takeaways
- What is data analysis in UX research?
- Why count instead of ask?
- How did we choose what to read?
- What did the scanner actually check?
- Why does every number carry its base?
- Does the sample match the result?
- What did the data actually find?
- Where does the data stop?
- How do you read drop-off in your own product?
- What should you do with the why?
- How do you use AI for data analysis without fooling yourself?
- When should you not start with data?
- What does this look like next time?
- FAQ
- Sources
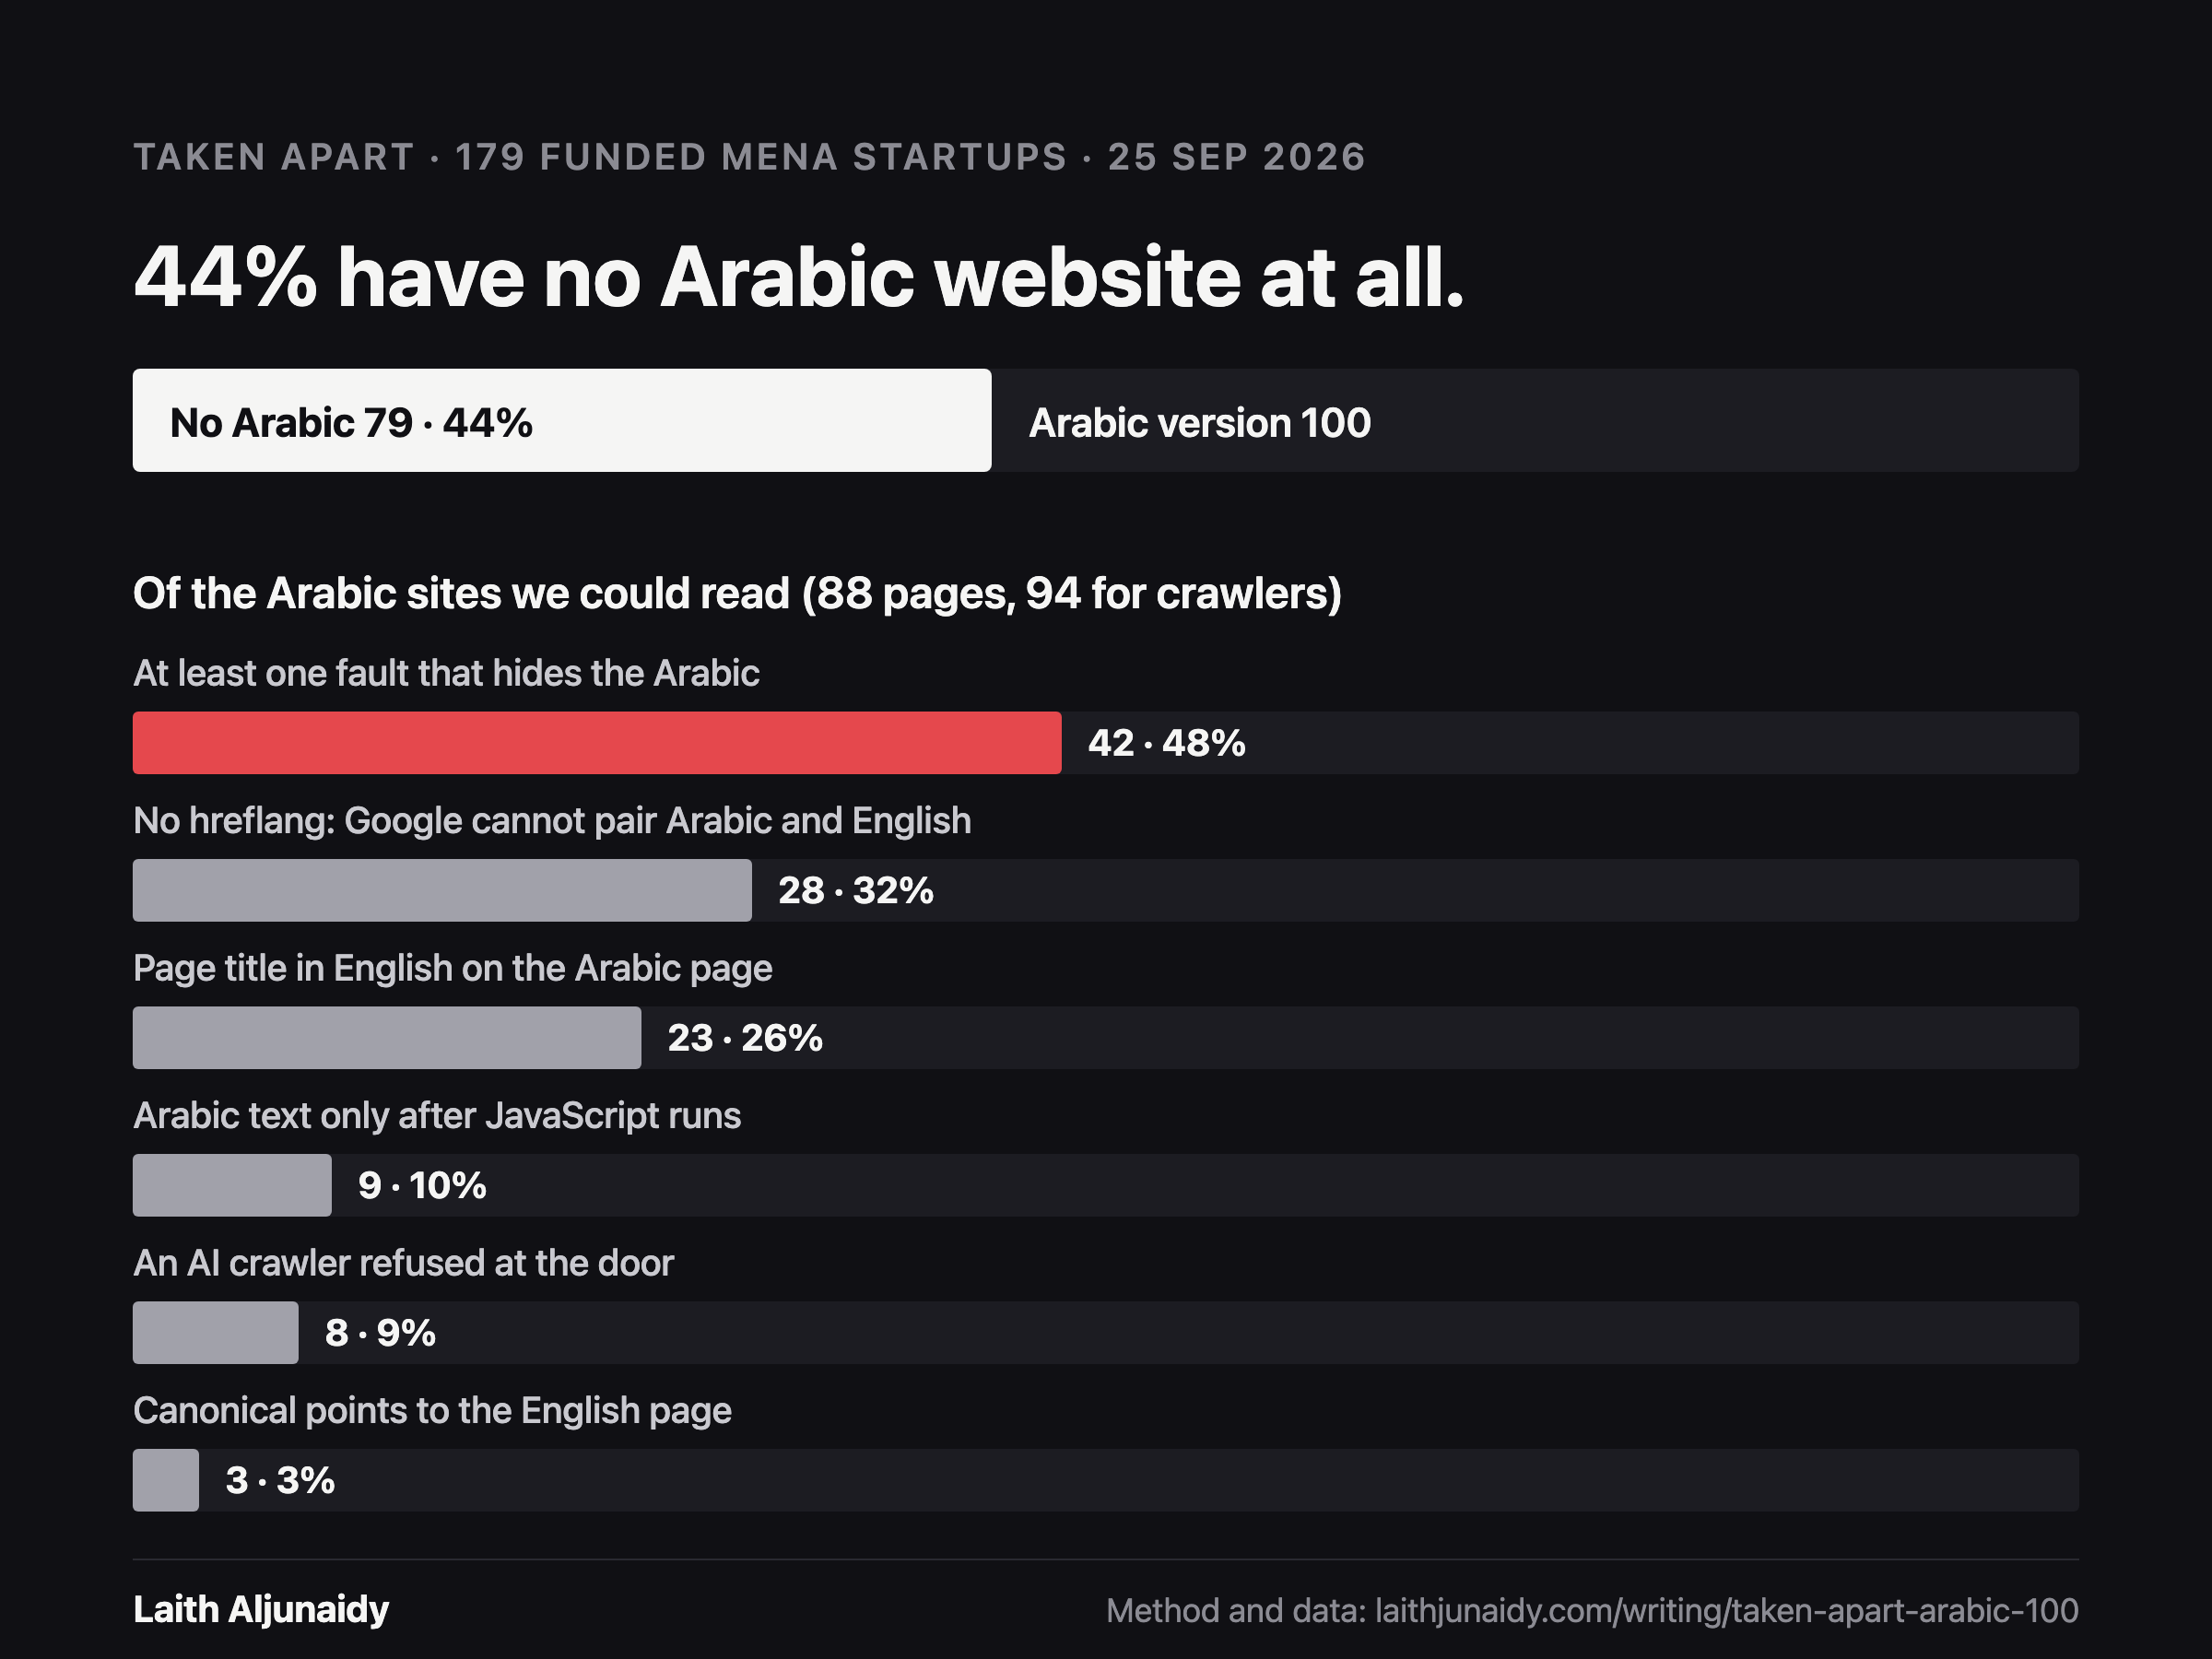
On 25 September 2026 I published Taken apart, number two. Of 179 funded startups in the region with a website we could check, 79 had no Arabic version at all. That is 44 percent.
Every founder in the region says the same thing about Arabic: of course we support it. I wanted to know what that means on the page, so I stopped asking and counted. One public list, read in order, every company checked, no picking. The commit that published the result carries Claude as co-author. The scanner, the sample and the notes on how the sample was drawn went up next to the essay, open for anyone to rerun.
The number is now the example under Data analysis in my design process guide. Read it a second time and the limit is right there in the result. The data says 53 of 67 funded UAE startups present themselves in English only. It does not say one word about why. Not whether the founders decided it, forgot it, could not afford it, or never thought their buyers read Arabic. Every reason I could give you would be a guess dressed as a finding.
That gap is the whole method. Data analysis tells you where people drop off. It never tells you why. This is how the scan was actually built and read, and what it teaches about using data in design.
Key takeaways
- Data analysis is reading what already exists before you make anything new: analytics, sales, support tickets, search logs, app reviews, public data, old research. It is the cheapest research there is, so it comes first.
- It answers where and how many. It cannot answer why. The why comes from interviews and watching people, and the data tells you who to ask and what to ask about.
- Decide the source and the order before you look. We read Wamda’s funding news newest to oldest and checked every qualifying company in turn. Nothing was chosen for having problems.
- Every number carries its base. The same 79 companies are 44 percent of 179 and 43 percent of 184. Both are true. Only one is honest without its denominator.
- Measured, never guessed. A site that could not be read was left out of that check and said so, not filled in.
- AI makes the analysis cheap. Checking it is now the skill: open the raw rows, rerun the count, and throw out any percentage that has no file behind it.
What is data analysis in UX research?
It is reading what already exists before you make anything new. The entry in my design process guide sits under Empathise and gives one reason to do it first: it costs the least. Support tickets, sales data, search logs, app reviews, old research. You walk away with where to look and the first questions for your interviews.
Nielsen Norman Group calls the wider family secondary research, also known as desk research, and says it should be a standard first step in any rigorous research practice. Their framing is practical: if somebody already ran a study, use it, and do not pay to rediscover what your own organisation learned two years ago.
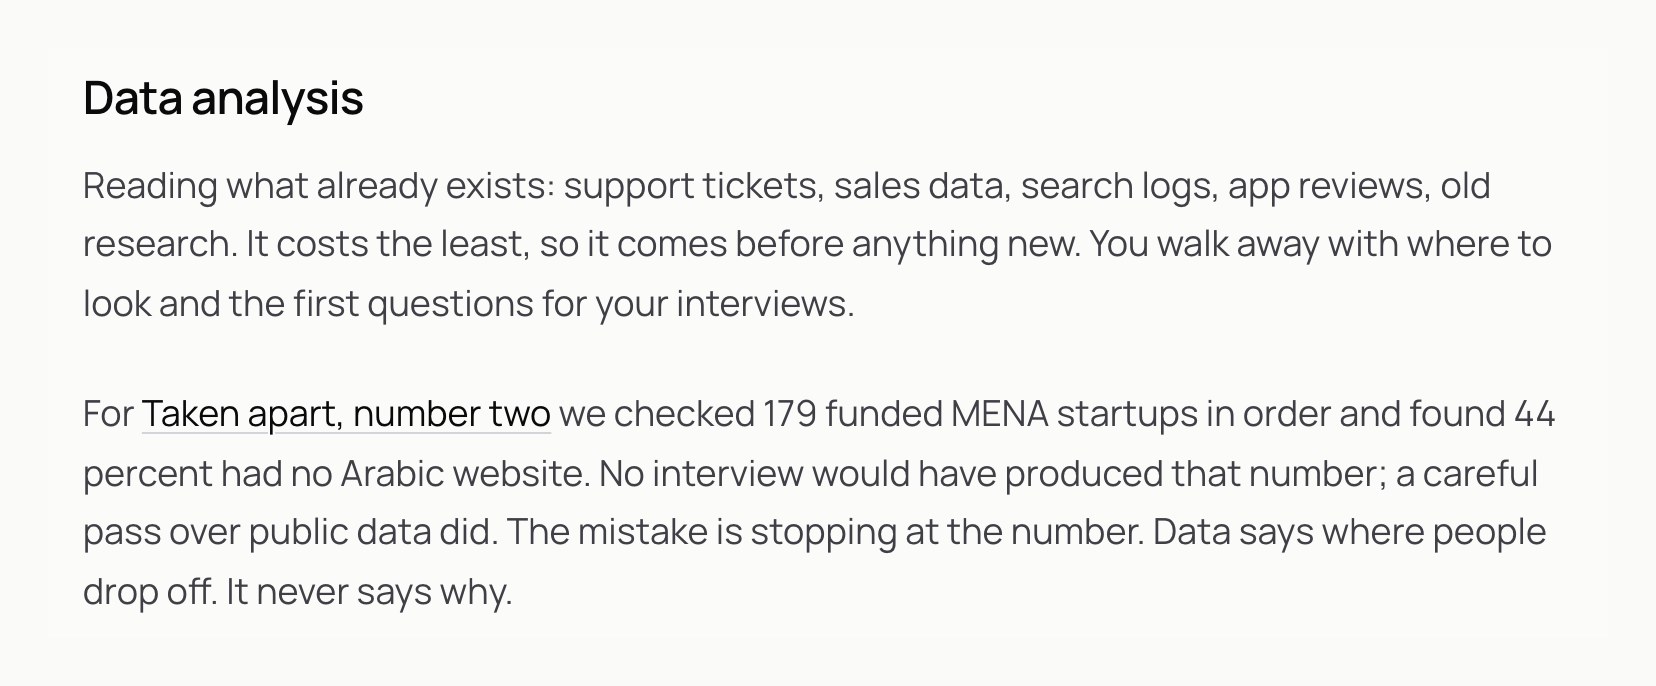
There are two kinds of data you can read this way.
Your own data is what your product already records: sessions, funnels, orders, the support inbox, the search box nobody looks at. This is where drop-off shows up: a step where many people arrive and few leave in the right direction.
Public data is what the world already published: funding news, competitors’ websites, app store reviews, government statistics. This is what we used for Taken apart. No one gave us access to anything. Every page we read was a page any visitor could open.
Both kinds have the same strength and the same limit. They record what happened. They do not record what anyone meant.
Why count instead of ask?
Because the question I had was a “how many” question, and people are bad at answering those about themselves.
If I had interviewed ten founders about their Arabic sites, I would have heard ten versions of “we support Arabic”. That is what people say out loud, and it is not a lie. To a founder, a translated homepage behind a language switch counts as support. The question that mattered was what that support looks like to someone landing on the page, to Google, and to the crawlers behind ChatGPT, Claude and Perplexity. That is not an opinion anyone holds. It is a fact sitting on a server, and you can go and read it.
That is the first rule of using data in design. Use it for the questions it can answer: how many, how often, where, since when. Use interviews for the questions it cannot: why, what were you trying to do, what did you expect to happen.
How did we choose what to read?
This is the part most data analysis skips, and it decides whether the result means anything.
The easy way to write this essay would have been to open twenty startup sites I already knew, find the broken ones, and count them. That produces a striking number and proves nothing. You find what you went looking for.
So the order was fixed before any site was opened. We used one public source, Wamda’s funding news, and read it in published order, newest to oldest: 473 articles, from 23 September 2026 back to 30 September 2025. No second list was mixed in, so every company came from the same ordered feed.
A headline qualified only if it reported a named company raising money: an announced round, a strategic investment or a credit facility. Funds, accelerators, acquisitions, exits, partnerships, launches and repeat mentions of the same company were out. The country had to be one of nine: Saudi Arabia, UAE, Egypt, Jordan, Kuwait, Qatar, Bahrain, Oman or Morocco. The sector had to be one of fintech, e-commerce, delivery, proptech, health, edtech, mobility, SaaS or HR. Licensed banks, government entities and companies known to have shut down were out.
184 companies passed. We checked them in order, good sites and bad, until 100 had an Arabic version. The hundredth was DOO, in Wamda’s article of 30 September 2025. The whole rule is written down in how the sample was drawn, published with the essay.
Three things in that paragraph do the real work.
The source is outside you. We did not pick the companies. Wamda did, by reporting their funding. That moves the selection out of my hands, which is where it should be when I already have an opinion about the answer.
The stopping rule is set in advance. “Until 100 had an Arabic version” is a rule you can check. “Until I had enough” is not.
The definition is written down. Arabic version means a visitor can reach Arabic page copy from the company’s own website: a language switcher, an hreflang Arabic link, an Arabic default homepage, or a redirect based on the browser’s language. Arabic that exists only inside the mobile app did not count. Neither did an Arabic URL that nothing links to, or a switcher that leaves the page in English. Those are judgement calls, and they sit in the notes where you can argue with them.
The sample itself is a plain file, sample.csv: company, country, sector, homepage, the Arabic URL, and the Wamda article that put the company on the list. 100 rows. Each row can be traced back to the article that justified it.
What did the scanner actually check?
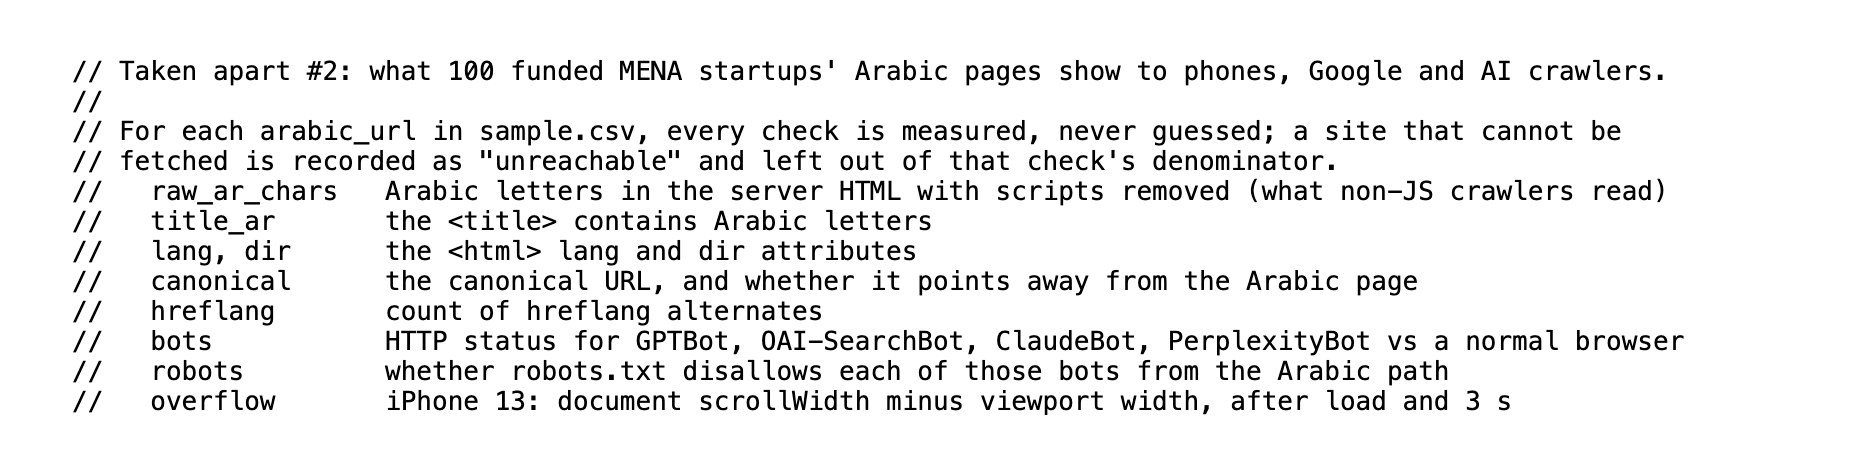
The scanner is one file, scan.mjs. The comment at the top lists every check it makes, and states the rule the whole study runs on: every check is measured, never guessed.
Each check stands in for a person or a machine reading the page.
| Check | What it reads | Who it stands in for |
|---|---|---|
| raw_ar_chars | Arabic letters in the server HTML, with scripts removed | AI crawlers that do not run JavaScript |
| title_ar | Whether the page title contains Arabic | An Arabic searcher reading the blue line in Google |
| lang, dir | The language and direction set on the page | Browsers, screen readers, search engines |
| canonical | Whether the page names itself or another page as the original | Google deciding which page to show |
| hreflang | How many language alternates the page declares | Google pairing the Arabic and English pages |
| bots | The HTTP status for GPTBot, OAI-SearchBot, ClaudeBot and PerplexityBot against a normal browser | ChatGPT, Claude and Perplexity |
| robots | Whether robots.txt forbids each of those bots | The site’s own stated rules |
| overflow | How far the page slides sideways on an iPhone 13 after it loads | A person on a phone |
Each fetch asks for Arabic first, follows redirects, and gives up after 25 seconds. The phone check opens the page in an iPhone 13 viewport, waits for it to load, waits three seconds more, and measures how much wider the page is than the screen.
The design choice I care most about is the one that sounds smallest. A site that could not be fetched is recorded as unreachable and left out of that check’s denominator. It is not counted as broken, and it is not counted as fine. It is counted as unknown, and the unknowns are reported.
That one rule is why the essay can say “of the 88 Arabic pages we could read in full” instead of “of 100”. Five sites gave the scanner no page on the day, four refusing it and one failing to load, so they are out of the page checks. Each had loaded in Arabic when the sample was checked, which is how they stayed in. Seven more are out of the text checks: the six the essay names, whose address does not change with the language, and one that draws its Arabic on a canvas, so there is no text to read. The bases shrink, and each figure says which base it uses: 179 companies, 88 pages, 94 pages for the crawler checks, and a different 94 for the phone check.
Why does every number carry its base?
Because the base is the number. A percentage without it is a mood.
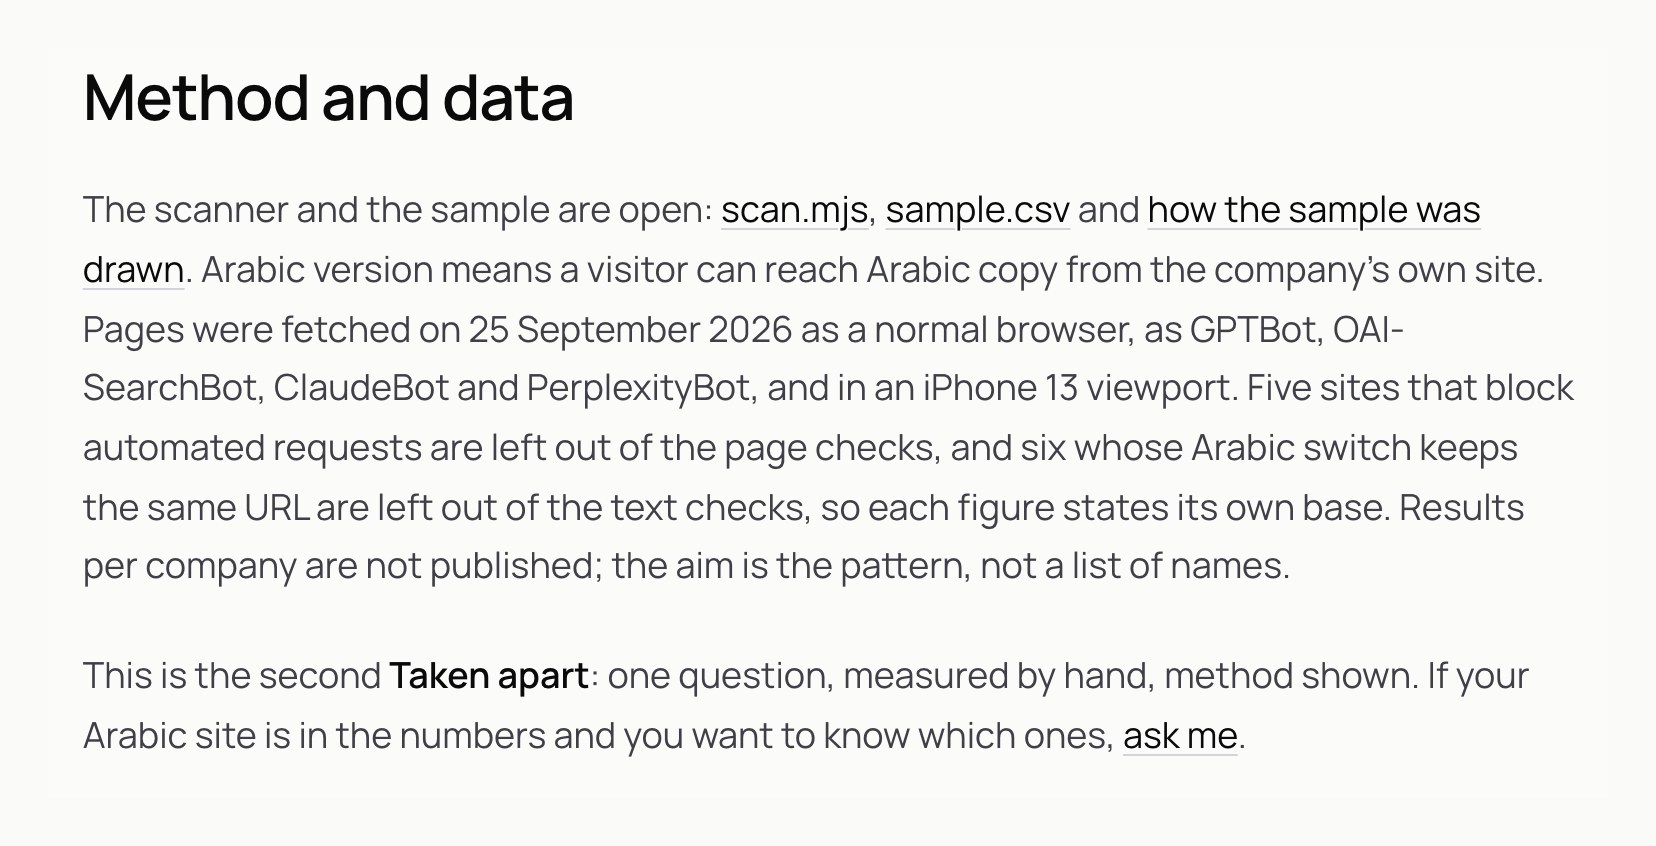
Here is a real case from the study. The essay says 79 of 179 companies have no Arabic version, 44 percent. The sample notes, published the same day, say 79 of the 184 had a working website with no Arabic version, 43 percent. Same 79 companies. Two different percentages.
Both are correct. 184 is every company that passed the filters. Four of those had no website we could find, and one was left out because its site blocked us from our location, so it could not be checked either way. Take those five out and you get the 179 we could actually judge. Dividing by 184 keeps five companies in the base that we never judged. Dividing by 179 says only what we saw.
The same thing happens with the UAE. The essay says 53 of 67. The sample notes say 53 of 69. The difference is two UAE companies with no website we could find. Again, same 53, different base, both true, and only one of them is a statement about websites.
Nobody would notice either difference if we had printed “44%” alone. That is exactly the problem. A bare percentage hides every decision behind it. The base puts the decision back on the page where the reader can argue with it.
So the rule to take from this, for research reports, dashboards and pitch decks alike: write the count, then the base, then the percentage. “79 of 179, 44 percent”. If you cannot fill in the first two, you do not have the third.
Does the sample match the result?
A good habit before you publish: check the published file against the published claim, the way a stranger would.
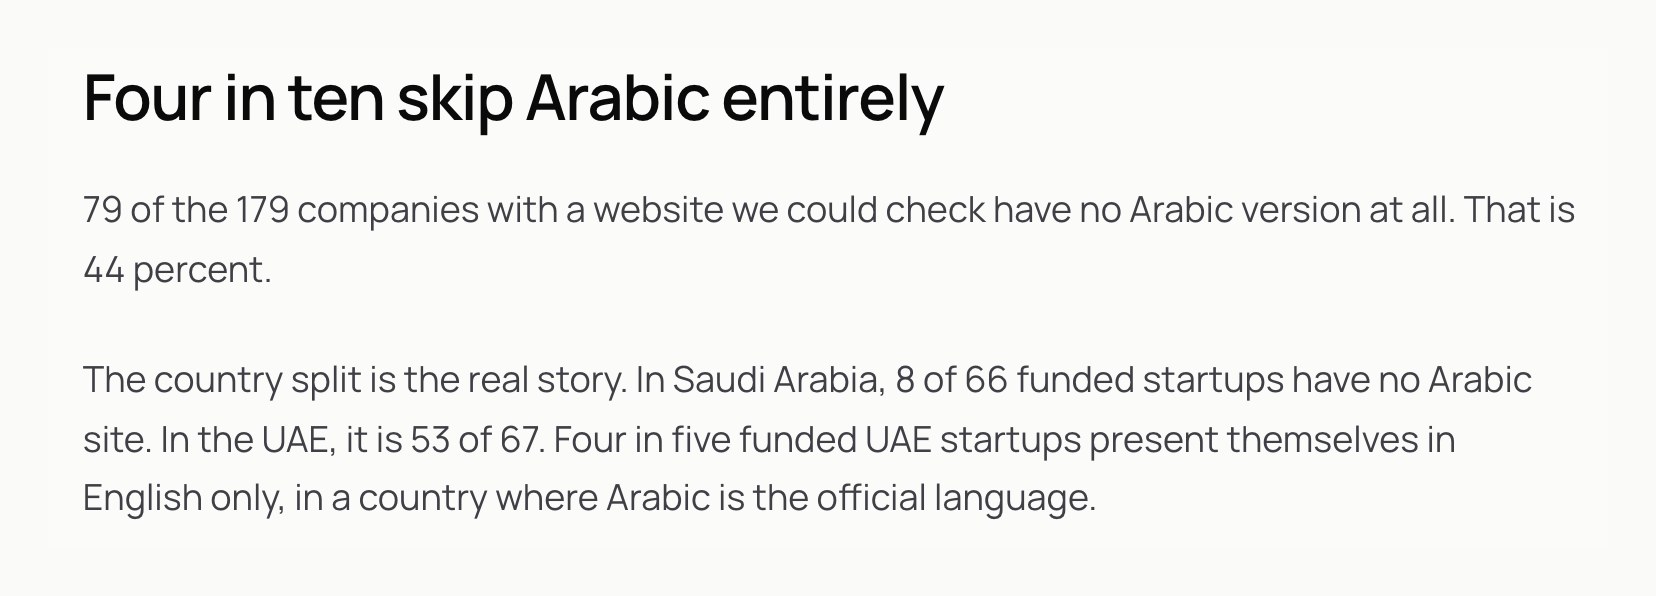
The essay says 8 of 66 funded Saudi startups have no Arabic site, so 58 do. Count the Saudi rows in sample.csv and you get 58. It says 53 of 67 UAE startups have no Arabic site, so 14 do. The UAE rows in the sample: 14. The file and the essay agree, and anyone can check them in a minute.
The sample also shows the shape of what was counted. 28 of the 100 companies are fintech, 22 are SaaS and 14 are e-commerce. 58 are Saudi. Any claim about “MENA startups” from this data is really a claim weighted towards Saudi fintech and software. The sector mix is who raised money and got reported in that year. The Saudi weight is the sample’s own rule at work: the list held about as many UAE companies as Saudi ones, 67 and 66, but only a company with an Arabic site reaches the sample. That is not a flaw in the method. It is a fact about who is in the file, and you say it out loud instead of letting a reader assume the sample looks like the whole region.
One more small thing the file shows: in 32 of the 100 rows, the Arabic page and the homepage are the same address. Sometimes that is an Arabic default homepage. Sometimes it is a language switch that changes the words and keeps the URL, which is the case the count had to leave out of the text checks. The file cannot tell you which is which. You have to open the site.
What did the data actually find?
Of the 88 Arabic pages we could read in full, 42 have at least one fault that keeps the Arabic away from search or AI answers. That is 48 percent.
- 28 have no hreflang, 32 percent. Google cannot tell the Arabic and English pages are the same content in two languages. Google explains how hreflang pairs language versions in its documentation on localized versions.
- 23 keep an English page title on the Arabic page, 26 percent.
- 9 have no Arabic in the page until JavaScript runs, 10 percent. To a crawler that reads the raw page, that Arabic site is empty.
- 8 of the 94 pages in the crawler checks refuse an AI crawler outright with an error, 9 percent. Only one of the eight says so in robots.txt.
- 3 point Google at the English page as the original, 3 percent.
The mobile layout, the thing people usually blame, was mostly fine. 4 of 94 pages slide sideways on an iPhone.
That last line is the reason to count. The count put the failures somewhere else, in the parts nobody sees: a title tag, a link element, a firewall rule. Data analysis is at its best when it proves you wrong about where to look.
Where does the data stop?
Look at the eight sites that refuse an AI crawler. The data is exact: the crawler asks for the page, the server answers with an error, a normal browser gets the page. And only one of the eight says so in robots.txt.
What it cannot tell you is whether anyone chose that. The essay says that for the other seven it is a firewall rule, not a choice anyone made. That is the most reasonable reading of the evidence: a decision you meant to make goes in robots.txt, and a default you never looked at sits in the firewall. But it is still a reading. The status code is the data. The intention behind it is an inference, and the only way to turn it into a fact is to ask the company.
The UAE number is the same. 53 of 67 funded UAE startups have no Arabic site. You can imagine the reasons. Their buyers are expats. Their investors read English. Arabic is on the roadmap. We never asked. Each of those leads to a different design decision, and the data treats all of them as the same row.
NN/g’s comparison of qualitative and quantitative research puts it in one line: quantitative data can tell you a design may not work, but it does not point out what problems users met, and it does not tell you what to change. That is the essay’s limit exactly. It ends with an offer, “if your Arabic site is in the numbers and you want to know which ones, ask me”, because the next step after a count is always a conversation.
How do you read drop-off in your own product?
The Taken apart scan is public data. Most data analysis in design is your own product’s numbers, and the shape is the same.
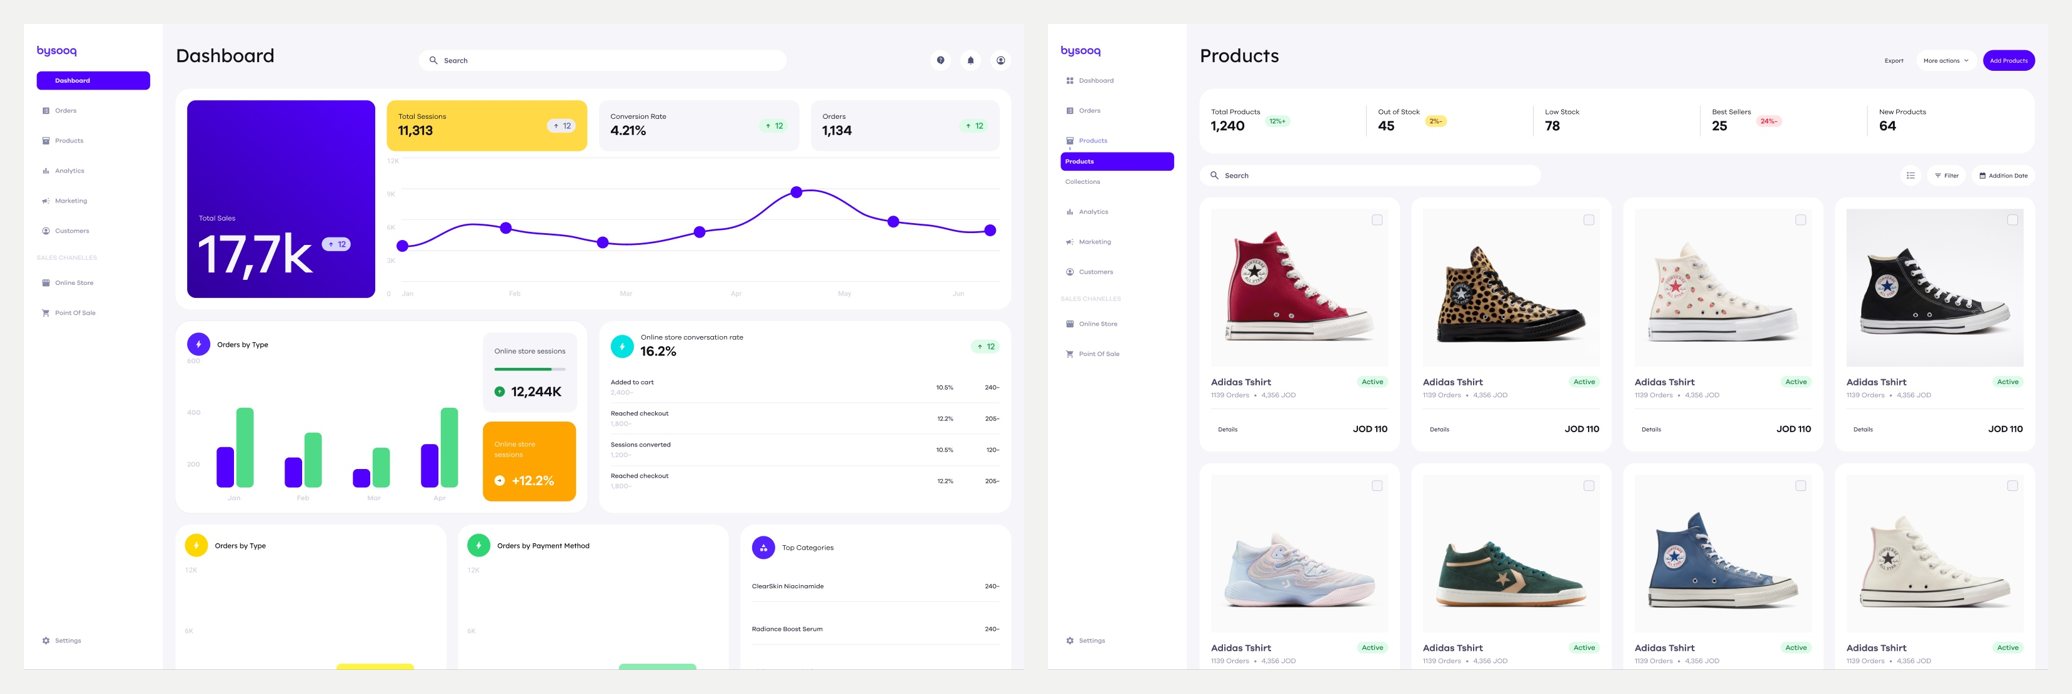
A funnel like that one is the most common form of drop-off data. Each step lists how many people reached it. The step where the count falls hardest is where you look first.
This is how I run it.
- Write the question before you open the dashboard. “Where do sellers’ customers leave between cart and payment?” is a question. “Let’s look at the analytics” is a way to lose an afternoon.
- Fix the window and the source. One date range, one data source, chosen before you look. Changing the range until the chart looks interesting is the dashboard version of picking twenty sites you already knew.
- Write the count and the base for every step. Not “checkout is bad”. “Of the people who reached checkout this month, this many paid.”
- Find the biggest fall, not every fall. Every funnel leaks at every step. The one to study is the step where the most people leave.
- Read the raw rows behind it. Open real sessions, real orders, real tickets from that step. Averages hide the person who tried three times.
- Stop and write the questions for interviews. The output of data analysis is not a fix. It is a short list of people to talk to and what to ask them.
Step six is the one people skip. The funnel says many people leave at checkout. It does not say whether the delivery fee surprised them, the payment method was missing, the page was in the wrong language, or they were only comparing prices. Each of those is a different screen. Pick one without asking and you are designing for your own guess, with a chart to make it look like research.
What should you do with the why?
Go and get it from people.
On Wfrah, the app we designed for sheep and goat breeders in the Gulf, breeders gave the same answer out loud: feed is expensive and buyers pay too little. If you only counted what people say, that would be your finding. The interviews showed what sat underneath. Many breeders could not work out the herd’s daily nutrition from the equations, and blaming the market made it easy to overlook nutrition and management. So the app carries a nutrition calculator that does the maths for them.
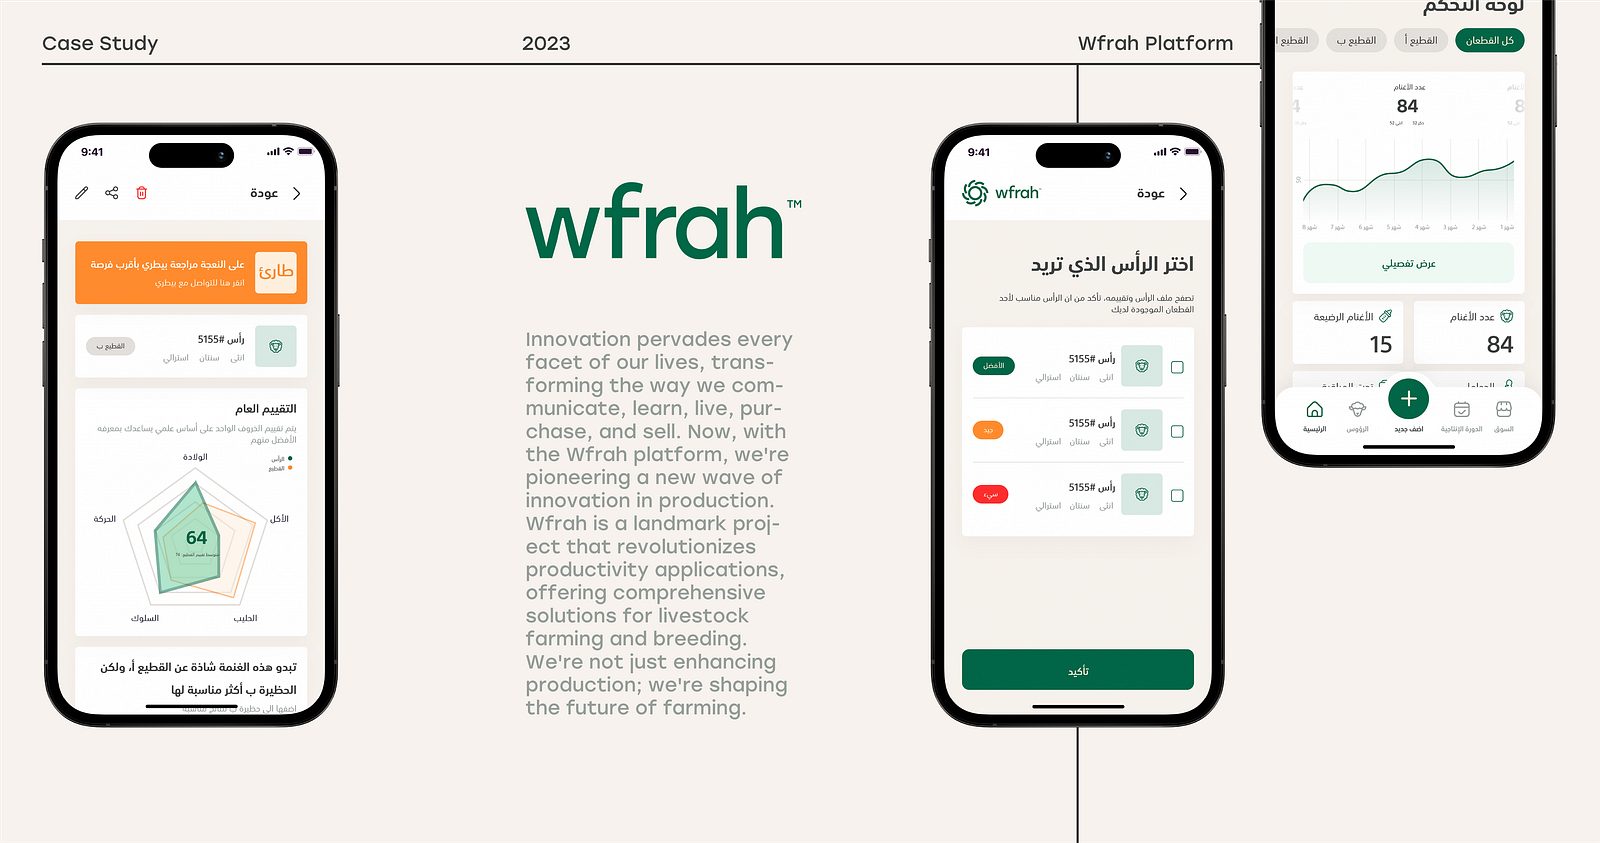
The working order is simple. Data analysis finds the where and sizes it. Interviews find the why. A user interview script built from the data asks about the last time the person hit that exact step. An affinity map sorts what they said, with a participant tag on every note so you can trace each theme back to a person. Then a problem statement says what you are fixing, and for whom, with the count from your data as the evidence of size.
How do you use AI for data analysis without fooling yourself?
AI made this method much cheaper. A model reads a thousand app reviews in a minute, sorts support tickets into themes, writes the scraper, and drafts the report. The tooling is moving fast. An October 2026 Show HN for Graphene, a data analysis toolkit for coding agents, put the open question plainly. The builders asked whether a coding agent can do most of a BI team’s work now, and answered: almost. They need a context layer “to ensure query correctness”.
Correctness is the whole game. A model that gets the query slightly wrong still hands back a confident chart. A model asked to summarise research will happily write “most users” or a round percentage that came from nowhere. The output looks finished, and finished is not the same as true.
What kept Taken apart honest was not a smarter model. It was a set of rules that make the work checkable, and they apply to any analysis an AI touches.
Make it write code, not conclusions. The scanner is a file that fetches pages and records what it saw. It does not decide anything. Ask the model for the script that counts, then run it yourself. A script can be reread and rerun. A paragraph cannot.
Make it record unknowns. “Measured, never guessed” is in the scanner’s first lines for a reason. If a model fills a missing value with a likely one, your result is part data and part fiction, and you cannot tell which part.
Demand the base for every number. Any percentage in an AI-written summary gets two questions: out of how many, and which file. If it cannot answer both, delete it. No exception for numbers that sound right.
Open the raw rows yourself. Before trusting a theme, read five real reviews in it. Before trusting a count, open three of the sites it counted. The Taken apart sample passes that test: the Saudi and UAE counts in the CSV match the essay.
Keep the order and the stopping rule outside the model. The model should not decide which records to read or when to stop. That is the easiest place for a convenient result to slip in, and it is a decision you own.
Publish the method if you publish the number. The scanner, the sample and the sampling notes sit next to the essay. That is the strongest check there is. If I got something wrong, anyone can find it.
I wrote about the other half of this in can AI replace user research: a model is good at drafting, sorting and listing, and bad at being your user. Data analysis is where it is most useful and most dangerous at once, because the output is numbers, and people trust numbers without reading them.
When should you not start with data?
When there is nothing to read yet, or when the data you have counts the wrong thing.
A new idea with no product has no sessions to analyse. Public data can still help: competitors’ sites, reviews of the closest product, the language people use in forums. But the main research is interviews, and you should not wait for numbers that do not exist.
Six survey answers are a hint, not a finding. Do not compute averages to the decimal and present them as a result. Say what they suggest and go and ask.
A metric can track the wrong outcome. Clicks, time on page and sessions can all rise when a page is confusing. If your data rewards the wrong behaviour, more analysis makes the problem look more precise. Decide what the user is trying to get done first, then choose the number that tracks it.
The population may write in a language your tools do not read well. Arabic reviews with dialect, mixed scripts and transliterated English are hard for tools to sort, and you will not see the errors unless you read the reviews yourself. That is one reason Taken apart counted things a machine reads exactly, Arabic letters and status codes, and avoided anything that needs a model to guess meaning.
What does this look like next time?
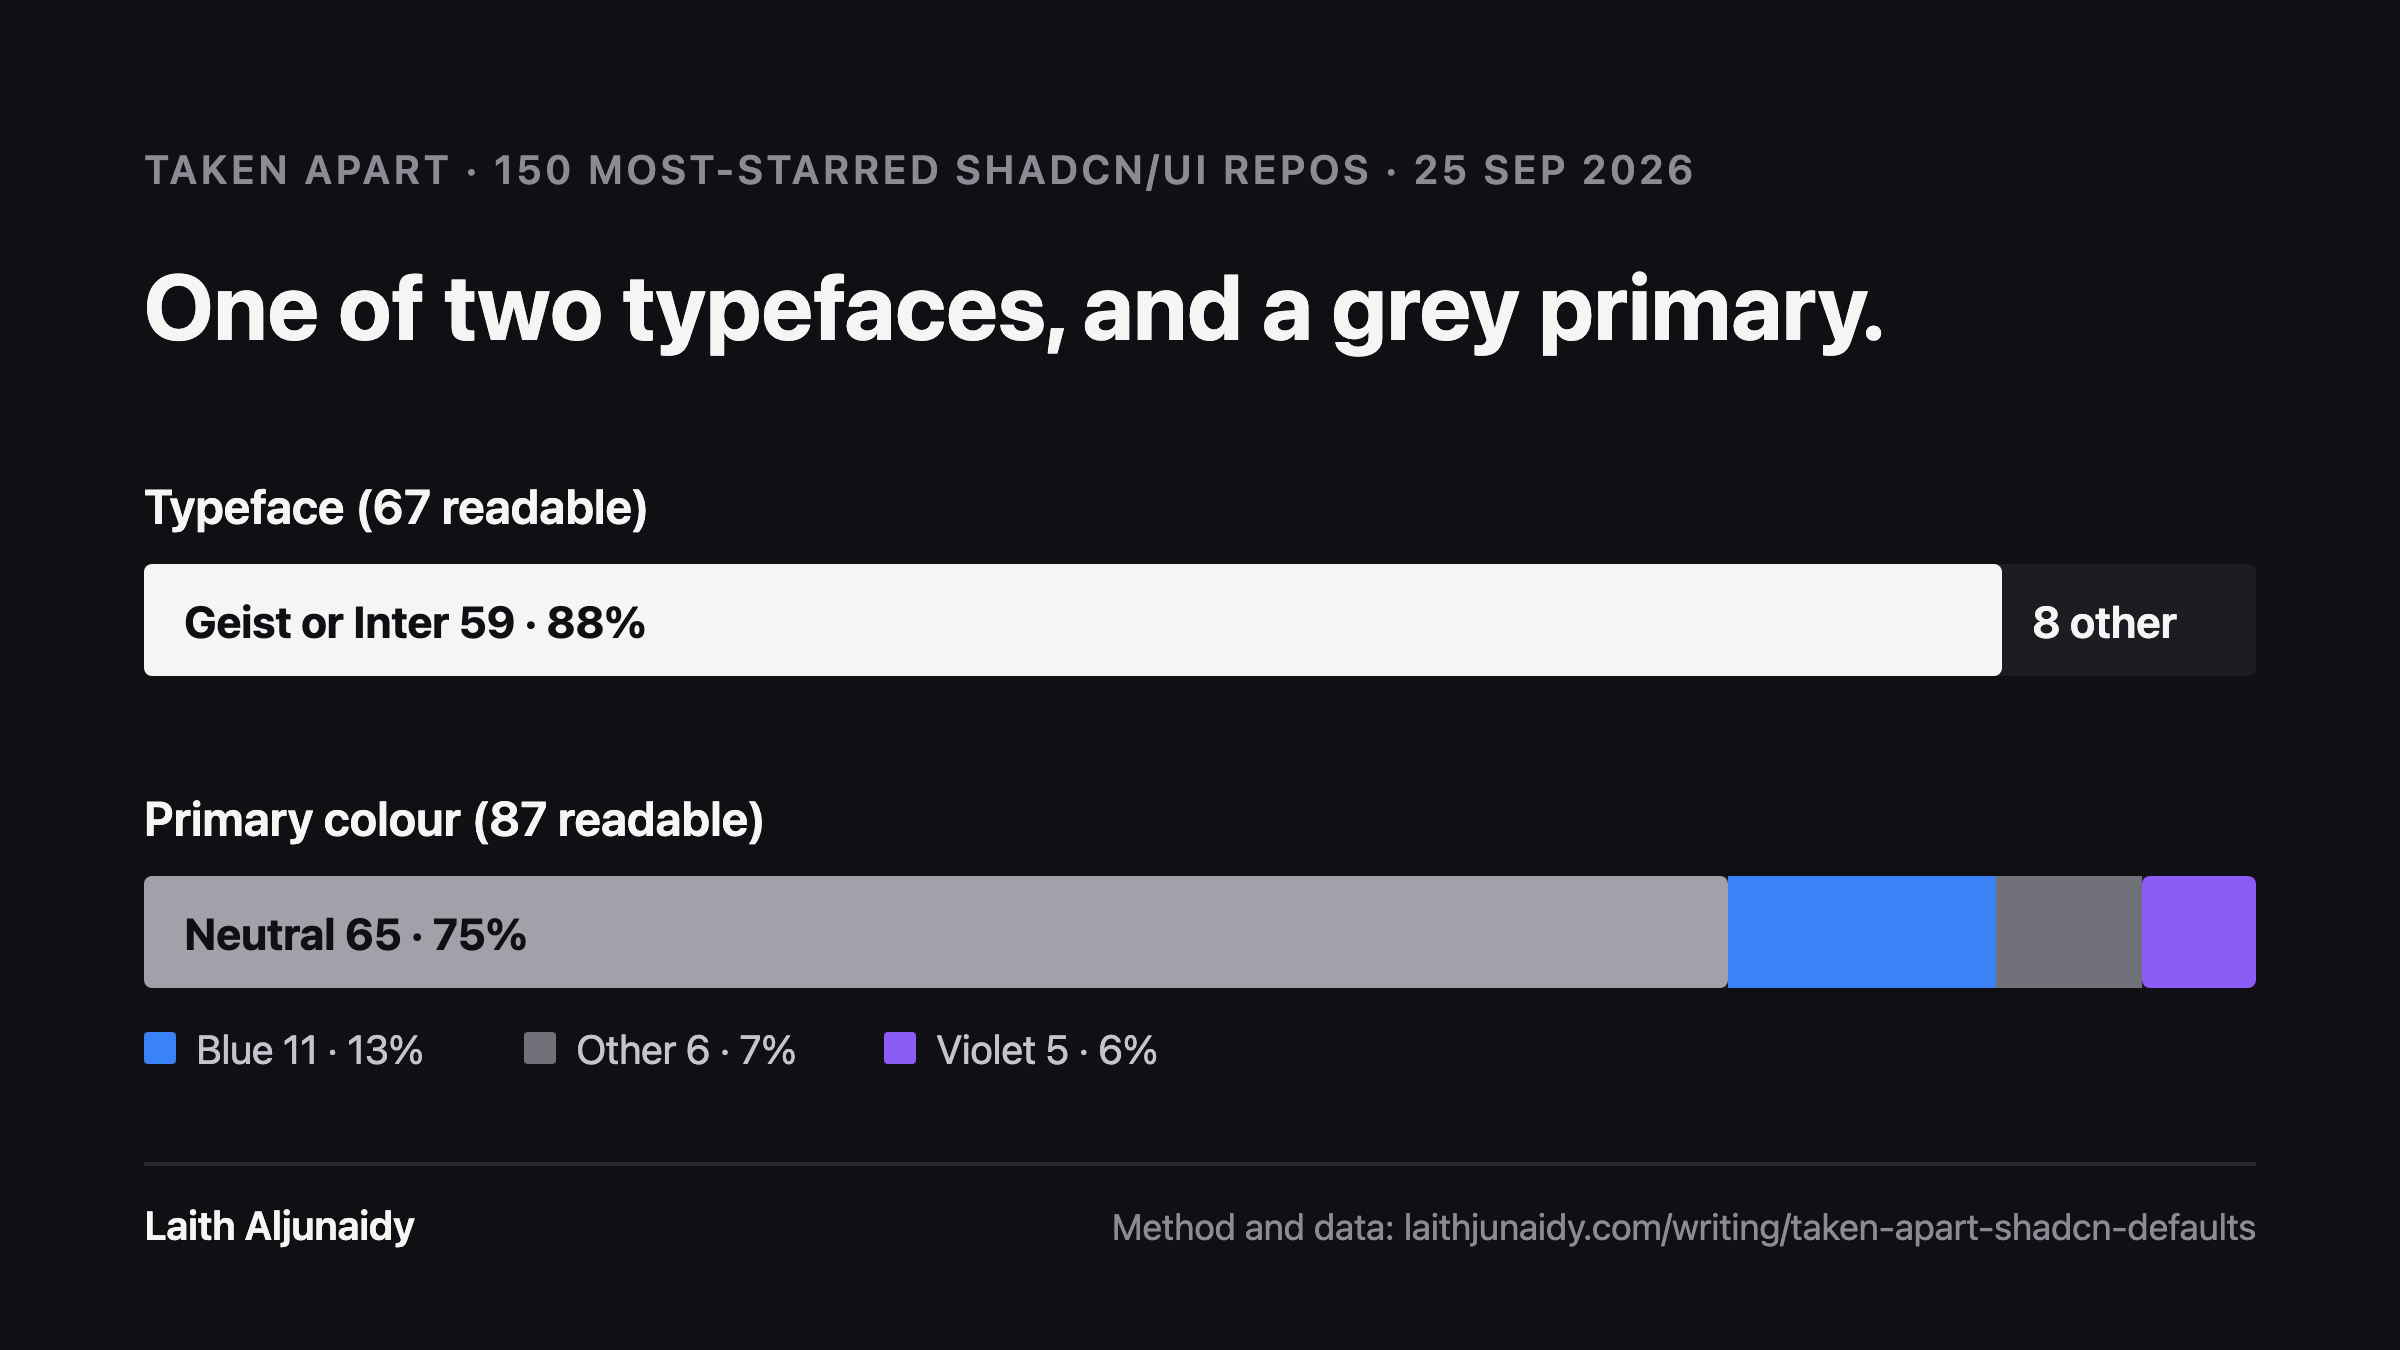
The same method works at any size. Taken apart, number one ran on GitHub instead of websites: the 150 most-starred shadcn/ui repositories, with the typeface and primary colour read from the code. A repo where the signal could not be read was counted as unreadable, never guessed, which left 67 with a readable typeface. 59 of those 67 use Geist or Inter. Same rules, different source.
If you want to run your own version, the order is:
- One question you could answer with a count.
- One source, read in a fixed order, with written rules for what qualifies.
- A stopping rule set in advance.
- Definitions written before the first record.
- A scanner or query that measures and records unknowns.
- Every result as count, base, percentage.
- A check of the published file against the published claim.
- The method and sample published next to the number.
- A list of the people you now need to ask why.
The last step is the one that turns analysis into design. The count tells you that 53 of 67 funded UAE startups are English only. It needed no access and no permission from anyone. Finding out why will take conversations, and the reason will decide what anyone should build.
FAQ
What is data analysis in UX?
Reading what already exists before you research or design anything new: analytics, funnels, sales, support tickets, search logs, app reviews and public data. It shows where people drop off and how many are affected. It is the cheapest research method, so it comes first, and it ends with questions for interviews, not with a fix.
What is the difference between data analysis and secondary research?
They overlap. Secondary research, or desk research, is gathering what others already found: reports, studies, old research. Data analysis is reading raw records yourself, your own product’s numbers or public data, and counting something. Taken apart was data analysis on public data: one funding feed, read in order, and the Arabic pages of 100 companies checked by a scanner.
Can data tell you why users drop off?
No. Data shows where people leave and how many. It cannot show what they were trying to do, what confused them, or what they expected. NN/g makes the same point: quantitative data can tell you something is not working, but not what problems users met or what to change. Use the data to choose who to interview and what to ask.
How do you analyse customer feedback with AI?
Give the model the raw feedback, ask for themes with every item tagged to its source, and ask for counts with their base. Then read five real items in each theme yourself, delete any percentage that has no count and no file behind it, and treat the result as questions for interviews. AI is fast at sorting. It is not a source of truth.
How big does a sample need to be?
Big enough for the question, and decided before you look. Taken apart set its rule in advance: check every qualifying company in order until 100 had an Arabic version, which took 184 companies. A tiny sample like six survey answers can still be useful, as a reason to go and talk to people, never as a finding on its own.
Why publish the scanner and the sample?
Because a number nobody can check is a claim, not a finding. Publishing scan.mjs, sample.csv and how the sample was drawn means anyone can rerun the study, find a mistake, or extend it. Results per company stayed private. The pattern was the point, not a list of names.
Sources
- secondary research nngroup.com
- funding news wamda.com
- localized versions developers.google.com
- NN/g’s comparison of qualitative and quantitative research nngroup.com
- Show HN for Graphene news.ycombinator.com